


General Dynamics Reports Third-Quarter 2019 Results
23 October 2019
RESTON, Va., Oct. 23, 2019 /PRNewswire/ -- General Dynamics (NYSE: GD) today reported third-quarter 2019 revenue of $9.8 billion, operating earnings of $1.2 billion, net earnings from continuing operations of $913 million and diluted earnings per share from continuing operations of $3.14, up 25 cents from the year-ago quarter.
"Margins advanced nicely in the quarter due to Gulfstream's continuing ability to efficiently transition its production to new models, coupled with solid operating performance at the defense businesses," said Phebe N. Novakovic, chairman and chief executive officer. "Our continued focus on operating excellence and driving cost efficiencies, coupled with new business opportunities, should enable us to build on these results."
Operating performance
Operating margin was 12.5 percent in the quarter, up 110 basis points sequentially. Customer deliveries of the Gulfstream G600 began in August, less than two months after receiving FAA type and production certificates.
Cash
Net cash provided by operating activities in the quarter totaled $1.1 billion. Free cash flow from operations, defined as net cash provided by operating activities less capital expenditures, was $847 million.
Capital deployment
The company paid $295 million in dividends and repaid approximately $450 million of its outstanding commercial paper in the third quarter. Capital expenditures totaled $244 million, up $76 million from the year-ago quarter, driven by continued strategic investments in Marine Systems.
Backlog
Total backlog at the end of third-quarter 2019 was $67.4 billion. Estimated potential contract value, representing management's estimate of value in unfunded indefinite delivery, indefinite quantity (IDIQ) contracts and unexercised options, was $35.6 billion. Total estimated contract value, the sum of all backlog components, was $103 billion.
Orders
Order activity remained strong across the aerospace and defense portfolios, with a book-to-bill of 1-to-1 on 7.3 percent year-over-year revenue growth. Significant awards in the defense portfolios in the quarter included $1.3 billion from the Canadian government for production of armored combat support vehicles; $1.1 billion from the U.S. Navy for design and construction of two Expeditionary Sea Base auxiliary support ships and a $550 million option for an additional ship; $390 million from the Navy for Advanced Nuclear Plant Studies in support of the Columbia-class submarine program; $155 million from the U.S. Army for various munitions and ordnance; $325 million to provide program management and engineering services to the Cybersecurity and Infrastructure Security Agency's emergency communications infrastructure; and $265 million from the Army for computing and communications equipment under the Common Hardware Systems-5 (CHS-5) program.
About General Dynamics
Headquartered in Reston, Virginia, General Dynamics is a global aerospace and defense company that offers a broad portfolio of products and services in business aviation; combat vehicles, weapons systems and munitions; IT services; C4ISR solutions; and shipbuilding and ship repair. General Dynamics employs more than 100,000 people worldwide and generated $36.2 billion in revenue in 2018. More information is available at www.gd.com.
Certain statements made in this press release, including any statements as to future results of operations and financial projections, may constitute "forward-looking statements" within the meaning of the Private Securities Litigation Reform Act of 1995, as amended. Forward-looking statements are based on management's expectations, estimates, projections and assumptions. These statements are not guarantees of future performance and involve risks and uncertainties that are difficult to predict. Therefore, actual future results and trends may differ materially from what is forecast in forward-looking statements due to a variety of factors. Additional information regarding these factors is contained in the company's filings with the Securities and Exchange Commission, including, without limitation, its Annual Report on Form 10-K and its Quarterly Reports on Form 10-Q. All forward-looking statements speak only as of the date they were made. The company does not undertake any obligation to update or publicly release any revisions to forward-looking statements to reflect events, circumstances or changes in expectations after the date of this press release.
WEBCAST INFORMATION: General Dynamics will webcast its third-quarter 2019 financial results conference call at 9 a.m. EDT on Wednesday, October 23, 2019. The webcast will be a listen-only audio event available at www.gd.com. An on-demand replay of the webcast will be available one hour after the end of the call and end on October 30. To hear a recording of the conference call by telephone, please call 1-877-344-7529 (international: 1-412-317-0088) passcode 10135319. Charts furnished to investors and securities analysts in connection with General Dynamics' announcement of its financial results for third-quarter 2019 are available at www.gd.com.
EXHIBIT A | |||||||||||||||||||||||
CONSOLIDATED STATEMENT OF EARNINGS - (UNAUDITED) | |||||||||||||||||||||||
DOLLARS IN MILLIONS, EXCEPT PER SHARE AMOUNTS | |||||||||||||||||||||||
Three Months Ended | Variance | ||||||||||||||||||||||
September 29, 2019 | September 30, 2018 | $ | % | ||||||||||||||||||||
Revenue | $ | 9,761 | $ | 9,094 | $ | 667 | 7.3 | % | |||||||||||||||
Operating costs and expenses | (8,545) | (7,959) | (586) | ||||||||||||||||||||
Operating earnings | 1,216 | 1,135 | 81 | 7.1 | % | ||||||||||||||||||
Interest, net | (114) | (114) | — | ||||||||||||||||||||
Other, net | (12) | 2 | (14) | ||||||||||||||||||||
Earnings from continuing operations before income tax | 1,090 | 1,023 | 67 | 6.5 | % | ||||||||||||||||||
Provision for income tax, net | (177) | (159) | (18) | ||||||||||||||||||||
Earnings from continuing operations | 913 | 864 | 49 | 5.7 | % | ||||||||||||||||||
Discontinued operations, net of tax | — | (13) | 13 | ||||||||||||||||||||
Net earnings | $ | 913 | $ | 851 | $ | 62 | 7.3 | % | |||||||||||||||
Earnings per share—basic | |||||||||||||||||||||||
Continuing operations | $ | 3.17 | $ | 2.92 | $ | 0.25 | 8.6 | % | |||||||||||||||
Discontinued operations | — | (0.04) | 0.04 | ||||||||||||||||||||
Net earnings | $ | 3.17 | $ | 2.88 | $ | 0.29 | 10.1 | % | |||||||||||||||
Basic weighted average shares outstanding | 288.4 | 295.3 | |||||||||||||||||||||
Earnings per share—diluted | |||||||||||||||||||||||
Continuing operations | $ | 3.14 | $ | 2.89 | $ | 0.25 | 8.7 | % | |||||||||||||||
Discontinued operations | — | (0.04) | 0.04 | ||||||||||||||||||||
Net earnings | $ | 3.14 | $ | 2.85 | $ | 0.29 | 10.2 | % | |||||||||||||||
Diluted weighted average shares outstanding | 290.9 | 299.1 | |||||||||||||||||||||
EXHIBIT B CONSOLIDATED STATEMENT OF EARNINGS - (UNAUDITED) DOLLARS IN MILLIONS, EXCEPT PER SHARE AMOUNTS | ||||||||||||||||||||||
Nine Months Ended | Variance | |||||||||||||||||||||
September 29, 2019 | September 30, 2018* | $ | % | |||||||||||||||||||
Revenue | $ | 28,577 | $ | 25,815 | $ | 2,762 | 10.7 | % | ||||||||||||||
Operating costs and expenses | (25,257) | (22,584) | (2,673) | |||||||||||||||||||
Operating earnings | 3,320 | 3,231 | 89 | 2.8 | % | |||||||||||||||||
Interest, net | (350) | (244) | (106) | |||||||||||||||||||
Other, net | 18 | (34) | 52 | |||||||||||||||||||
Earnings from continuing operations before income tax | 2,988 | 2,953 | 35 | 1.2 | % | |||||||||||||||||
Provision for income tax, net | (524) | (504) | (20) | |||||||||||||||||||
Earnings from continuing operations | 2,464 | 2,449 | 15 | 0.6 | % | |||||||||||||||||
Discontinued operations, net of tax | — | (13) | 13 | |||||||||||||||||||
Net earnings | $ | 2,464 | $ | 2,436 | $ | 28 | 1.1 | % | ||||||||||||||
Earnings per share—basic | ||||||||||||||||||||||
Continuing operations | $ | 8.55 | $ | 8.27 | $ | 0.28 | 3.4 | % | ||||||||||||||
Discontinued operations | — | (0.04) | 0.04 | |||||||||||||||||||
Net earnings | $ | 8.55 | $ | 8.23 | $ | 0.32 | 3.9 | % | ||||||||||||||
Basic weighted average shares outstanding | 288.1 | 296.0 | ||||||||||||||||||||
Earnings per share—diluted | ||||||||||||||||||||||
Continuing operations | $ | 8.47 | $ | 8.16 | $ | 0.31 | 3.8 | % | ||||||||||||||
Discontinued operations | — | (0.04) | 0.04 | |||||||||||||||||||
Net earnings | $ | 8.47 | $ | 8.12 | $ | 0.35 | 4.3 | % | ||||||||||||||
Diluted weighted average shares outstanding | 290.8 | 300.1 | ||||||||||||||||||||
* | 2018 results include the unfavorable impact of one-time charges of approximately $75 associated with costs to complete the acquisition of CSRA Inc. In the table above, approximately $45 of compensation-related costs was reported in operating costs and expenses, and approximately $30 of transaction costs was reported in other, net. |
EXHIBIT C REVENUE AND OPERATING EARNINGS BY SEGMENT - (UNAUDITED) DOLLARS IN MILLIONS | ||||||||||||||||||||||
Three Months Ended | Variance | |||||||||||||||||||||
September 29, 2019 | September 30, 2018 | $ | % | |||||||||||||||||||
Revenue: | ||||||||||||||||||||||
Aerospace | $ | 2,495 | $ | 2,031 | $ | 464 | 22.8 | % | ||||||||||||||
Combat Systems | 1,740 | 1,523 | 217 | 14.2 | % | |||||||||||||||||
Information Technology | 2,071 | 2,307 | (236) | (10.2) | % | |||||||||||||||||
Mission Systems | 1,220 | 1,230 | (10) | (0.8) | % | |||||||||||||||||
Marine Systems | 2,235 | 2,003 | 232 | 11.6 | % | |||||||||||||||||
Total | $ | 9,761 | $ | 9,094 | $ | 667 | 7.3 | % | ||||||||||||||
Operating earnings: | ||||||||||||||||||||||
Aerospace | $ | 393 | $ | 376 | $ | 17 | 4.5 | % | ||||||||||||||
Combat Systems | 264 | 241 | 23 | 9.5 | % | |||||||||||||||||
Information Technology | 146 | 157 | (11) | (7.0) | % | |||||||||||||||||
Mission Systems | 185 | 179 | 6 | 3.4 | % | |||||||||||||||||
Marine Systems | 209 | 169 | 40 | 23.7 | % | |||||||||||||||||
Corporate | 19 | 13 | 6 | 46.2 | % | |||||||||||||||||
Total | $ | 1,216 | $ | 1,135 | $ | 81 | 7.1 | % | ||||||||||||||
Operating margin: | ||||||||||||||||||||||
Aerospace | 15.8 | % | 18.5 | % | ||||||||||||||||||
Combat Systems | 15.2 | % | 15.8 | % | ||||||||||||||||||
Information Technology | 7.0 | % | 6.8 | % | ||||||||||||||||||
Mission Systems | 15.2 | % | 14.6 | % | ||||||||||||||||||
Marine Systems | 9.4 | % | 8.4 | % | ||||||||||||||||||
Total | 12.5 | % | 12.5 | % | ||||||||||||||||||
EXHIBIT D REVENUE AND OPERATING EARNINGS BY SEGMENT - (UNAUDITED) DOLLARS IN MILLIONS | ||||||||||||||||||||||
Nine Months Ended | Variance | |||||||||||||||||||||
September 29, 2019 | September 30, 2018* | $ | % | |||||||||||||||||||
Revenue: | ||||||||||||||||||||||
Aerospace | $ | 6,871 | $ | 5,751 | $ | 1,120 | 19.5 | % | ||||||||||||||
Combat Systems | 5,035 | 4,497 | 538 | 12.0 | % | |||||||||||||||||
Information Technology | 6,398 | 5,887 | 511 | 8.7 | % | |||||||||||||||||
Mission Systems | 3,655 | 3,475 | 180 | 5.2 | % | |||||||||||||||||
Marine Systems | 6,618 | 6,205 | 413 | 6.7 | % | |||||||||||||||||
Total | $ | 28,577 | $ | 25,815 | $ | 2,762 | 10.7 | % | ||||||||||||||
Operating earnings: | ||||||||||||||||||||||
Aerospace | $ | 1,052 | $ | 1,108 | $ | (56) | (5.1) | % | ||||||||||||||
Combat Systems | 712 | 701 | 11 | 1.6 | % | |||||||||||||||||
Information Technology | 456 | 414 | 42 | 10.1 | % | |||||||||||||||||
Mission Systems | 495 | 478 | 17 | 3.6 | % | |||||||||||||||||
Marine Systems | 586 | 548 | 38 | 6.9 | % | |||||||||||||||||
Corporate | 19 | (18) | 37 | 205.6 | % | |||||||||||||||||
Total | $ | 3,320 | $ | 3,231 | $ | 89 | 2.8 | % | ||||||||||||||
Operating margin: | ||||||||||||||||||||||
Aerospace | 15.3 | % | 19.3 | % | ||||||||||||||||||
Combat Systems | 14.1 | % | 15.6 | % | ||||||||||||||||||
Information Technology | 7.1 | % | 7.0 | % | ||||||||||||||||||
Mission Systems | 13.5 | % | 13.8 | % | ||||||||||||||||||
Marine Systems | 8.9 | % | 8.8 | % | ||||||||||||||||||
Total | 11.6 | % | 12.5 | % | ||||||||||||||||||
* | 2018 results include the unfavorable impact of approximately $45 of compensation-related one-time charges associated with costs to complete the acquisition of CSRA Inc. This amount was reported as a reduction of Corporate operating earnings in the table above. |
EXHIBIT E CONSOLIDATED BALANCE SHEET DOLLARS IN MILLIONS | |||||||||||
(Unaudited) | |||||||||||
September 29, 2019 | December 31, 2018 | ||||||||||
ASSETS | |||||||||||
Current assets: | |||||||||||
Cash and equivalents | $ | 974 | $ | 963 | |||||||
Accounts receivable | 3,489 | 3,759 | |||||||||
Unbilled receivables | 8,077 | 6,576 | |||||||||
Inventories | 6,573 | 5,977 | |||||||||
Other current assets | 1,038 | 914 | |||||||||
Total current assets | 20,151 | 18,189 | |||||||||
Noncurrent assets: | |||||||||||
Property, plant and equipment, net | 4,217 | 3,978 | |||||||||
Intangible assets, net | 2,376 | 2,585 | |||||||||
Goodwill | 19,617 | 19,594 | |||||||||
Other assets | 2,427 | 1,062 | |||||||||
Total noncurrent assets | 28,637 | 27,219 | |||||||||
Total assets | $ | 48,788 | $ | 45,408 | |||||||
LIABILITIES AND SHAREHOLDERS' EQUITY | |||||||||||
Current liabilities: | |||||||||||
Short-term debt and current portion of long-term debt | $ | 4,661 | $ | 973 | |||||||
Accounts payable | 2,999 | 3,179 | |||||||||
Customer advances and deposits | 6,854 | 7,270 | |||||||||
Other current liabilities | 3,713 | 3,317 | |||||||||
Total current liabilities | 18,227 | 14,739 | |||||||||
Noncurrent liabilities: | |||||||||||
Long-term debt | 8,989 | 11,444 | |||||||||
Other liabilities | 8,059 | 7,493 | |||||||||
Total noncurrent liabilities | 17,048 | 18,937 | |||||||||
Shareholders' equity: | |||||||||||
Common stock | 482 | 482 | |||||||||
Surplus | 2,999 | 2,946 | |||||||||
Retained earnings | 30,909 | 29,326 | |||||||||
Treasury stock | (17,346) | (17,244) | |||||||||
Accumulated other comprehensive loss | (3,531) | (3,778) | |||||||||
Total shareholders' equity | 13,513 | 11,732 | |||||||||
Total liabilities and shareholders' equity | $ | 48,788 | $ | 45,408 | |||||||
EXHIBIT F CONSOLIDATED STATEMENT OF CASH FLOWS - (UNAUDITED) DOLLARS IN MILLIONS | |||||
Nine Months Ended | |||||
September 29, 2019 | September 30, 2018 | ||||
Cash flows from operating activities—continuing operations: | |||||
Net earnings | $ | 2,464 | $ | 2,436 | |
Adjustments to reconcile net earnings to net cash from operating activities: | |||||
Depreciation of property, plant and equipment | 352 | 315 | |||
Amortization of intangible and finance lease right-of-use assets | 273 | 227 | |||
Equity-based compensation expense | 103 | 110 | |||
Deferred income tax benefit | (72) | (66) | |||
Discontinued operations, net of tax | — | 13 | |||
(Increase) decrease in assets, net of effects of business acquisitions: | |||||
Accounts receivable | 253 | 472 | |||
Unbilled receivables | (1,603) | (1,625) | |||
Inventories | (646) | (854) | |||
Increase (decrease) in liabilities, net of effects of business acquisitions: | |||||
Accounts payable | (164) | (324) | |||
Customer advances and deposits | (565) | 112 | |||
Other, net | 192 | 265 | |||
Net cash provided by operating activities | 587 | 1,081 | |||
Cash flows from investing activities: | |||||
Capital expenditures | (606) | (447) | |||
Business acquisitions, net of cash acquired | (19) | (10,039) | |||
Other, net | 21 | 169 | |||
Net cash used by investing activities | (604) | (10,317) | |||
Cash flows from financing activities: | |||||
Proceeds from commercial paper, net | 947 | 1,668 | |||
Dividends paid | (858) | (801) | |||
Purchases of common stock | (231) | (533) | |||
Proceeds from fixed-rate notes | — | 6,461 | |||
Proceeds from floating-rate notes | — | 1,000 | |||
Repayment of CSRA accounts receivable purchase agreement | — | (450) | |||
Other, net | 207 | (68) | |||
Net cash provided by financing activities | 65 | 7,277 | |||
Net cash used by discontinued operations | (37) | (14) | |||
Net increase (decrease) in cash and equivalents | 11 | (1,973) | |||
Cash and equivalents at beginning of period | 963 | 2,983 | |||
Cash and equivalents at end of period | $ | 974 | $ | 1,010 | |
EXHIBIT G PRELIMINARY FINANCIAL INFORMATION - (UNAUDITED) DOLLARS IN MILLIONS, EXCEPT PER SHARE AMOUNTS | |||||||||||||||||||||||
Other Financial Information: | |||||||||||||||||||||||
September 29, 2019 | December 31, 2018 | ||||||||||||||||||||||
Debt-to-equity (a) | 101.0 | % | 105.8 | % | |||||||||||||||||||
Debt-to-capital (b) | 50.3 | % | 51.4 | % | |||||||||||||||||||
Book value per share (c) | $ | 46.71 | $ | 40.64 | |||||||||||||||||||
Shares outstanding | 289,306,108 | 288,698,149 | |||||||||||||||||||||
Third Quarter | Nine Months | ||||||||||||||||||||||
2019 | 2018 | 2019 | 2018 | ||||||||||||||||||||
Income tax payments, net | $ | 90 | $ | 150 | $ | 487 | $ | 305 | |||||||||||||||
Company-sponsored research and | $ | 110 | $ | 126 | $ | 352 | $ | 356 | |||||||||||||||
Non-GAAP Financial Measures: | |||||||||||||||||||||||
Third Quarter | Nine Months | ||||||||||||||||||||||
2019 | 2018 | 2019 | 2018 | ||||||||||||||||||||
Earnings before interest, taxes, | |||||||||||||||||||||||
Earnings from continuing operations | $ | 913 | $ | 864 | $ | 2,464 | $ | 2,449 | |||||||||||||||
Interest, net | 114 | 114 | 350 | 244 | |||||||||||||||||||
Provision for income tax, net | 177 | 159 | 524 | 504 | |||||||||||||||||||
Depreciation of property, plant and | 120 | 109 | 352 | 315 | |||||||||||||||||||
Amortization of intangible and | 90 | 106 | 273 | 227 | |||||||||||||||||||
Earnings before interest, taxes, | $ | 1,414 | $ | 1,352 | $ | 3,963 | $ | 3,739 | |||||||||||||||
Free cash flow from operations: | |||||||||||||||||||||||
Net cash provided by operating | $ | 1,091 | $ | 790 | $ | 587 | $ | 1,081 | |||||||||||||||
Capital expenditures | (244) | (168) | (606) | (447) | |||||||||||||||||||
Free cash flow from operations (f) | $ | 847 | $ | 622 | $ | (19) | $ | 634 | |||||||||||||||
(a) | Debt-to-equity ratio is calculated as total debt divided by total equity as of the end of the period. | |
(b) | Debt-to-capital ratio is calculated as total debt divided by the sum of total debt plus total equity as of the end of the period. | |
(c) | Book value per share is calculated as total equity divided by total outstanding shares as of the end of the period. | |
(d) | Includes independent research and development and Aerospace product-development costs. | |
(e) | We believe earnings before interest, taxes, depreciation and amortization (EBITDA) is a useful measure for investors because it provides another measure of our profitability and our ability to service our debt. We calculate EBITDA by adding back interest, taxes, depreciation and amortization to earnings from continuing operations. The most directly comparable GAAP measure to EBITDA is earnings from continuing operations. | |
(f) | We believe free cash flow from operations is a useful measure for investors because it portrays our ability to generate cash from our businesses for purposes such as repaying maturing debt, funding business acquisitions, repurchasing our common stock and paying dividends. We use free cash flow from operations to assess the quality of our earnings and as a key performance measure in evaluating management. The most directly comparable GAAP measure to free cash flow from operations is net cash provided by operating activities. |
EXHIBIT H BACKLOG - (UNAUDITED) DOLLARS IN MILLIONS | ||||||||||||||||||||||||||||||||
Funded | Unfunded | Total | Estimated Potential Contract Value* | Total | ||||||||||||||||||||||||||||
Third Quarter 2019: | ||||||||||||||||||||||||||||||||
Aerospace | $ | 11,195 | $ | 188 | $ | 11,383 | $ | 2,065 | $ | 13,448 | ||||||||||||||||||||||
Combat Systems | 15,069 | 449 | 15,518 | 4,255 | 19,773 | |||||||||||||||||||||||||||
Information Technology | 4,782 | 4,381 | 9,163 | 18,063 | 27,226 | |||||||||||||||||||||||||||
Mission Systems | 5,152 | 307 | 5,459 | 6,764 | 12,223 | |||||||||||||||||||||||||||
Marine Systems | 17,801 | 8,072 | 25,873 | 4,497 | 30,370 | |||||||||||||||||||||||||||
Total | $ | 53,999 | $ | 13,397 | $ | 67,396 | $ | 35,644 | $ | 103,040 | ||||||||||||||||||||||
Second Quarter 2019: | ||||||||||||||||||||||||||||||||
Aerospace | $ | 11,932 | $ | 213 | $ | 12,145 | $ | 2,079 | $ | 14,224 | ||||||||||||||||||||||
Combat Systems | 14,794 | 438 | 15,232 | 4,113 | 19,345 | |||||||||||||||||||||||||||
Information Technology | 4,446 | 4,405 | 8,851 | 17,983 | 26,834 | |||||||||||||||||||||||||||
Mission Systems | 4,925 | 258 | 5,183 | 6,847 | 12,030 | |||||||||||||||||||||||||||
Marine Systems | 18,344 | 7,899 | 26,243 | 3,223 | 29,466 | |||||||||||||||||||||||||||
Total | $ | 54,441 | $ | 13,213 | $ | 67,654 | $ | 34,245 | $ | 101,899 | ||||||||||||||||||||||
Third Quarter 2018: | ||||||||||||||||||||||||||||||||
Aerospace | $ | 11,696 | $ | 173 | $ | 11,869 | $ | 2,239 | $ | 14,108 | ||||||||||||||||||||||
Combat Systems | 15,865 | 395 | 16,260 | 3,857 | 20,117 | |||||||||||||||||||||||||||
Information Technology | 5,222 | 4,731 | 9,953 | 17,365 | 27,318 | |||||||||||||||||||||||||||
Mission Systems | 5,024 | 587 | 5,611 | 7,453 | 13,064 | |||||||||||||||||||||||||||
Marine Systems | 16,615 | 9,221 | 25,836 | 3,797 | 29,633 | |||||||||||||||||||||||||||
Total | $ | 54,422 | $ | 15,107 | $ | 69,529 | $ | 34,711 | $ | 104,240 | ||||||||||||||||||||||
* | The estimated potential contract value includes work awarded on unfunded indefinite delivery, indefinite quantity (IDIQ) contracts and unexercised options associated with existing firm contracts, including options and other agreements with existing customers to purchase new aircraft and aircraft services. We recognize options in backlog when the customer exercises the option and establishes a firm order. For IDIQ contracts, we evaluate the amount of funding we expect to receive and include this amount in our estimated potential contract value. The actual amount of funding received in the future may be higher or lower than our estimate of potential contract value. |
EXHIBIT H-1
BACKLOG - (UNAUDITED)
DOLLARS IN MILLIONS
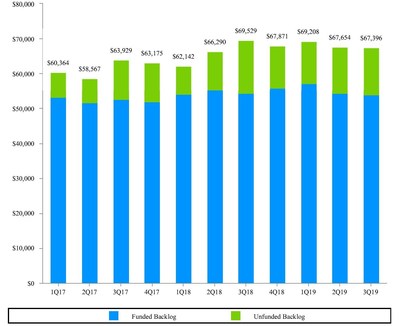
Photo - https://mma.prnewswire.com/media/1015481/EXHIBIT_H_1_Consolidated.webp
EXHIBIT H-2
BACKLOG BY SEGMENT - (UNAUDITED)
DOLLARS IN MILLIONS
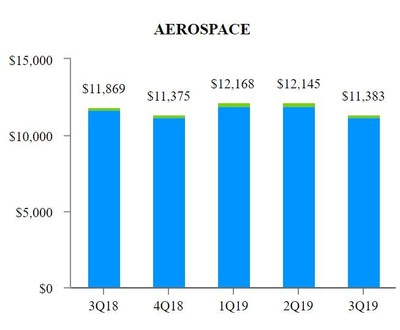
Photo - https://mma.prnewswire.com/media/1015480/EXHIBIT_H_2_Aerospace.webp
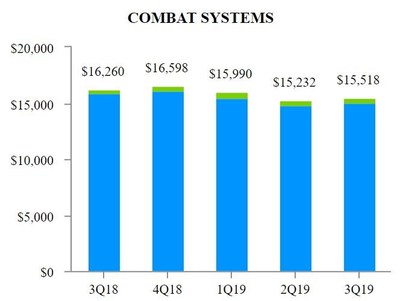
Photo - https://mma.prnewswire.com/media/1015479/EXHIBIT_H_2_Combat_Systems.webp
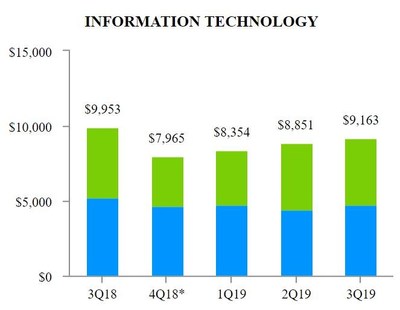
Photo - https://mma.prnewswire.com/media/1015478/EXHIBIT_H_2_Information_Technology.webp
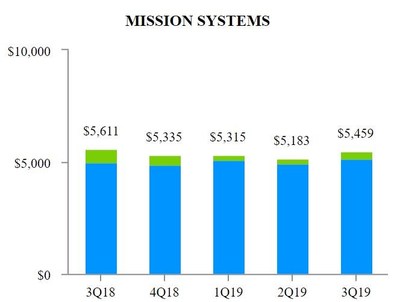
Photo - https://mma.prnewswire.com/media/1015477/EXHIBIT_H_2_Mission_Systems.webp
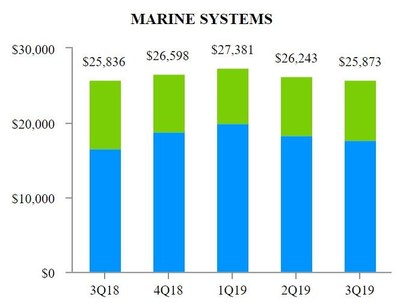
Photo - https://mma.prnewswire.com/media/1015476/EXHIBIT_H_2_Marine_Systems.webp

Photo - https://mma.prnewswire.com/media/1015526/EXHIBIT_H_2_Key.webp
EXHIBIT I
THIRD QUARTER 2019 SIGNIFICANT ORDERS - (UNAUDITED)
DOLLARS IN MILLIONS
We received the following significant contract awards during the third quarter of 2019:
Combat Systems:
- $1.3 billion from the Canadian government to produce armored combat support vehicles (ACSVs) and provide associated support services.
- $155 from the U.S. Army for various munitions and ordnance.
- $70 to produce gun systems for the F-35 Joint Strike Fighter.
- $55 from the Army for various maintenance and enhancements at the Lima Army Tank Plant in Lima, Ohio.
Information Technology:
- An IDIQ contract to provide command, control, communications, computers, intelligence, surveillance and reconnaissance (C4ISR) installation services for the U.S. Navy. The program has a maximum potential value of $2.5 billion among 6 awardees.
- A contract to provide program management and engineering services to the Cybersecurity and Infrastructure Security Agency's (CISA) emergency communications infrastructure. The contract has a maximum potential value of $325.
- A contract from the U.S. Department of Veterans Affairs under the Veterans Intake, Conversion and Communications Services (VICCS) program to provide support and communication services to U.S. veterans. The contract has a maximum potential value of $280.
- $155 from the U.S. Department of State to provide business process support services for the Bureau of Consular Affairs' Global Support Strategy (GSS) program for visa services.
- $125 to provide design, development, testing, installation, maintenance, logistics support and modernization services for Navy airborne and shipboard platforms.
- $95 from the Centers for Medicare and Medicaid Services for several key contracts, including support of the Medicare Secondary Payer (MSP) program. These contracts have a maximum potential value of $220.
Mission Systems:
- $265 from the Army for computing and communications equipment under the Common Hardware Systems-5 program.
- $95 from the Army to provide continued software support and engineering for the Warfighter Information Network-Tactical (WIN-T) Increment 2 program.
- $65 from the Navy to provide fire control system modifications for ballistic-missile and guided-missile submarines.
- $45 from the Navy to produce five Knifefish surface mine countermeasure systems and associated support equipment.
- $25 from the Army for the production of Prophet enhanced ground-based signals intelligence and electronic warfare systems. The contract has a maximum potential value of $295.
Marine Systems:
- $1.1 billion from the Navy for design and construction of two Expeditionary Sea Base (ESB) auxiliary support ships and an option totaling approximately $550 for an additional ship.
- $175 from the Navy to provide engineering, technical, design and planning yard support services for operational strategic and attack submarines. The program has a maximum potential value of $1 billion.
- $390 from the Navy for Advanced Nuclear Plant Studies (ANPS) in support of the Columbia-class submarine program.
- $110 from the Navy to provide maintenance and repair services for the USS Kearsarge, an amphibious assault ship.
EXHIBIT J AEROSPACE SUPPLEMENTAL DATA - (UNAUDITED) | |||||||||||||||||||||||||
Third Quarter | Nine Months | ||||||||||||||||||||||||
2019 | 2018 | 2019 | 2018 | ||||||||||||||||||||||
Gulfstream Aircraft Deliveries (units): | |||||||||||||||||||||||||
Large-cabin aircraft | 29 | 21 | 79 | 58 | |||||||||||||||||||||
Mid-cabin aircraft | 9 | 6 | 24 | 21 | |||||||||||||||||||||
Total | 38 | 27 | 103 | 79 | |||||||||||||||||||||
Pre-owned Aircraft Deliveries (units): | 4 | 2 | 9 | 4 | |||||||||||||||||||||
Aerospace Book-to-Bill: | |||||||||||||||||||||||||
Orders* | $ | 1,693 | $ | 1,743 | $ | 7,022 | $ | 5,479 | |||||||||||||||||
Revenue (excluding pre-owned aircraft sales) | 2,404 | 1,962 | 6,735 | 5,672 | |||||||||||||||||||||
Book-to-Bill Ratio | 0.70x | 0.89x | 1.04x | 0.97x | |||||||||||||||||||||
* | Does not include customer defaults, liquidated damages, cancellations, foreign exchange fluctuations and other backlog adjustments. |

 View original content:http://www.prnewswire.com/news-releases/general-dynamics-reports-third-quarter-2019-results-300943615.html
SOURCE General Dynamics